Senate voting patterns
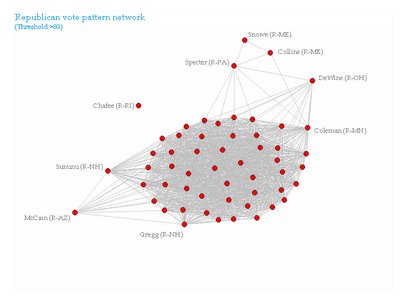
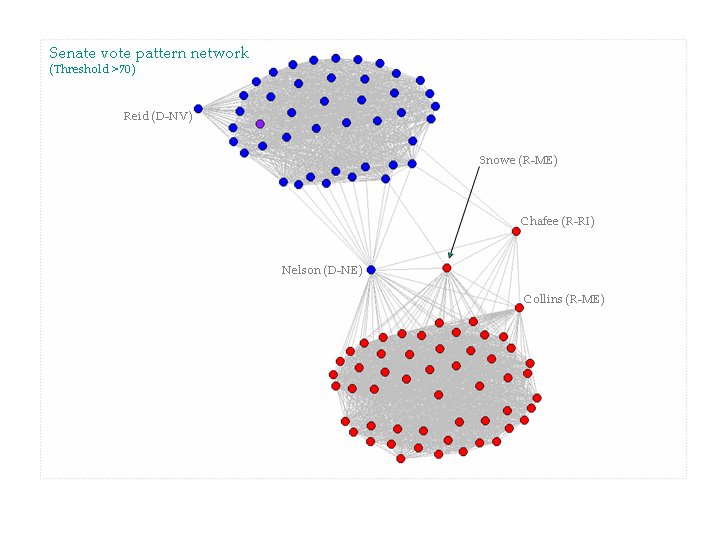
I have started analyzing the voting patterns in the Senate. Although this post involves political analysis, future posts may involve analysis of demographics, pop culture, sports, education, buying patterns, the stock market or anything else that I happen to be looking into at the time. I made a matrix that shows how often senators vote the same. For instance, Kerry and Kennedy voted the same direction 94% of the time, while Kerry and Frist cast the same vote only 34% of the time. All of these comparisons are corrected for the many times that senators do not vote. From the 100 x 100 matrix I was able to make graphs/networks of voting patterns by using various thresholds. The network below was made by using a threshold of >70%. I have highlighted a few senators. The networks were made with Pajek, a free social network analysis (SNA) program.
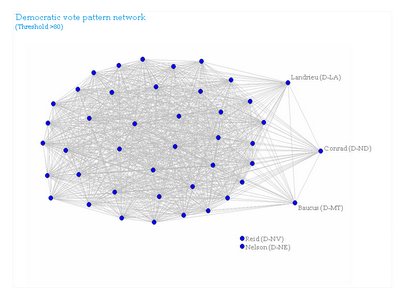
 If we focus on the two major parties (treating Jeffords, an Independent, as a Democrat) we are able to see some internal structure.
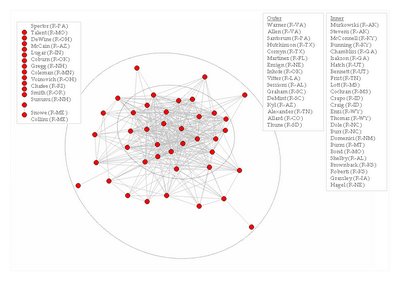
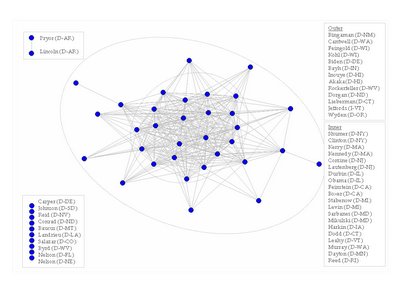
By increasing the threshold we lose information but gain some insight into the core of each party. The core of the republican party is made up of what some might call "middle of the road" Republicans. While the core of the Democratic party is made up of the most liberal cluster of Democrats.
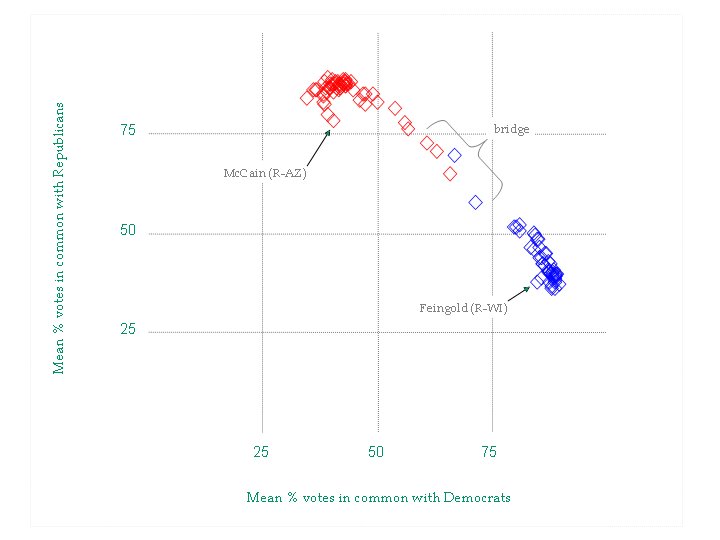
Another way to look at the data is to plot how each senator voted on average compared to all of the Democrats and all of the Republicans. The scatter plot below shows just that. I have highlighted McCain and Feingold as well as the "bridge senators". This view helps show how McCain's voting deviates from the other republicans. Some think of McCain as a moderate Republican, but he is anything but moderate. In every analysis he clusters with Sununu, Gregg, and Kyl, but does not vote similar to Chafee, Snowe, Collins or Specter, the true moderate republicans.
 If we focus on the two major parties (treating Jeffords, an Independent, as a Democrat) we are able to see some internal structure.
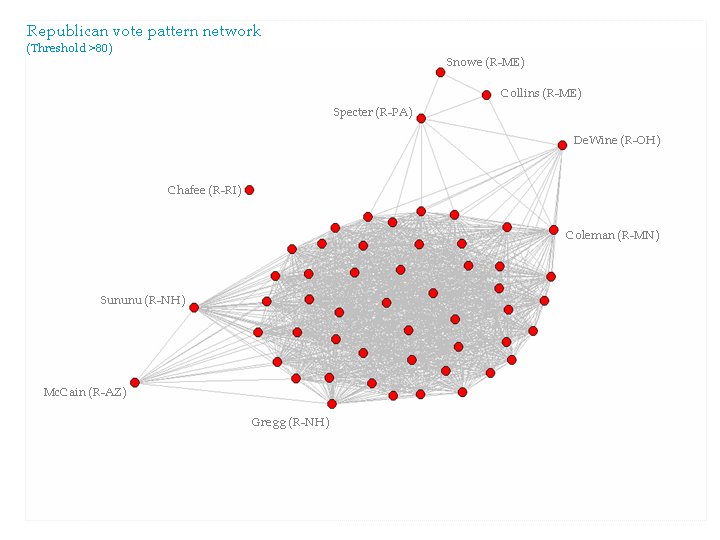
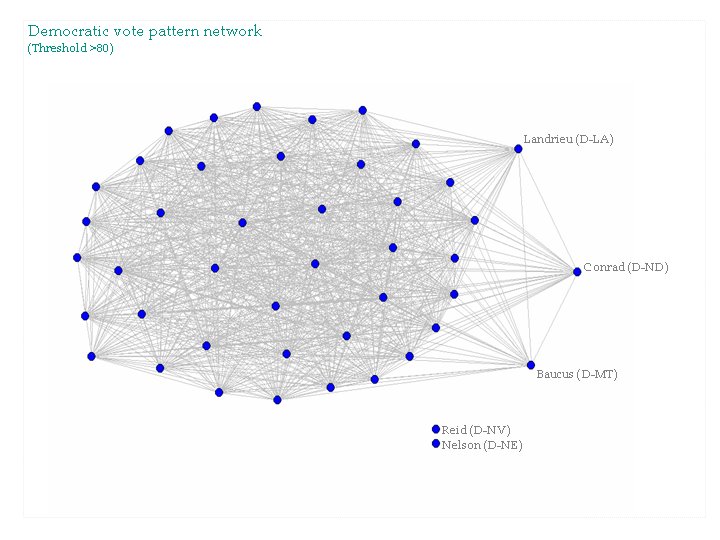
By increasing the threshold we lose information but gain some insight into the core of each party. The core of the republican party is made up of what some might call "middle of the road" Republicans. While the core of the Democratic party is made up of the most liberal cluster of Democrats.


Another way to look at the data is to plot how each senator voted on average compared to all of the Democrats and all of the Republicans. The scatter plot below shows just that. I have highlighted McCain and Feingold as well as the "bridge senators". This view helps show how McCain's voting deviates from the other republicans. Some think of McCain as a moderate Republican, but he is anything but moderate. In every analysis he clusters with Sununu, Gregg, and Kyl, but does not vote similar to Chafee, Snowe, Collins or Specter, the true moderate republicans.
posted by peoplewatcher at 7:17 PM
![]()
![]()

6 Comments:
There was a paper published on this topic (with more of a quantitative focus) in KDD last year. I don't recall the title off the top of my head, but it shouldn't be hard to find.
Check out also:
Data Mining in Politics - Aleks Jakulin
http://www.ailab.si/aleks/politics/
for nice analysis of the senate roll-call votes with MDS and clustering
Thanks for the link to the previous analysis. Interestingly, I also used hierarchical clustering and PCA, but didn't think the visuals added much. This blog is not for hard-core political analysis, I'll leave that to the political scientists. Instead I am a generalist, and plan on showing similar initial analysis from other fields. My true interests are in clarity and design of information graphics.
The pattern of polarization keeps popping up! This link shows readership of political books... same obvious blue/red divide.
Great work Andrew!!!
Drew..
I am working on something similar and would love to see your work..Kim
It's been a pleasure to read this post, It really helped me to open up my eyes. Thanks for publishing.
Post a Comment
<< Home