Senate Voting Patterns, part 2
Since my last post was well received I have decided to stretch the analysis of senate voting networks into additional posts. Also, I have included a graphic to help explain what these networks represent. All of the data presented in this post is from the U. S. Senate roll call votes for 2001.
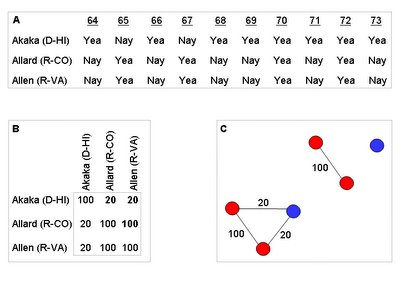
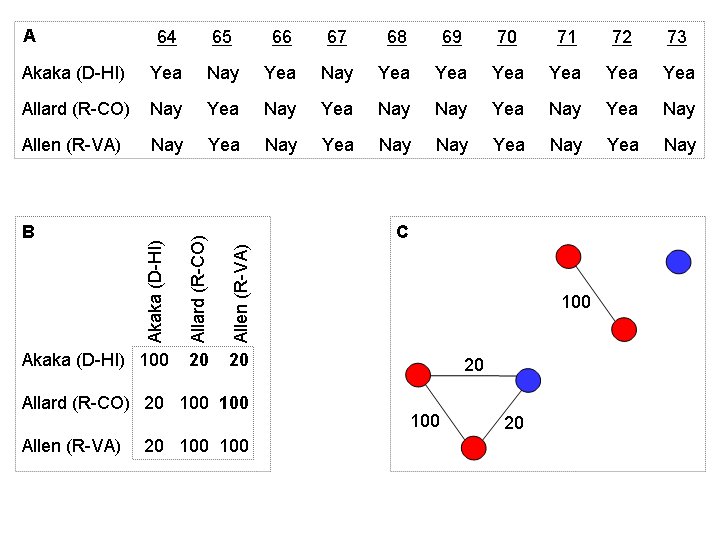
The first figure, I hope, explains what these networks represent. You can see in part (A) there is a small table that is part of a large table of vote data. For 2001 there were 380 votes, here you can see ten votes for just three senators. I take all of the votes and compute a matrix similar the one in part (B). The matrix summarizes the percent of votes that senators have in common. I use the percent numbers to make networks. The links in the networks have a weight to them that is the same as the percent from the matrix. In Pajek, the network analysis program, I set thresholds to reduce the weak links. Part (C) show a network before and after the threshold.
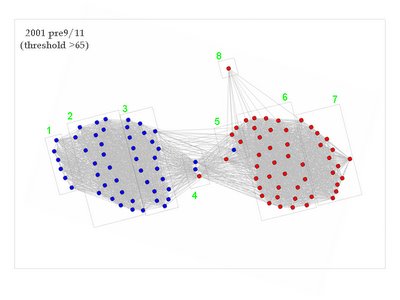
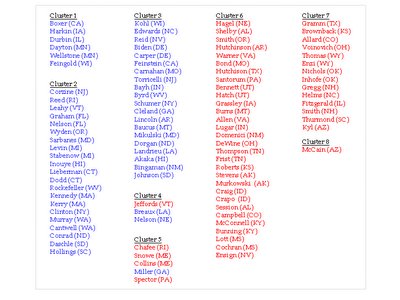
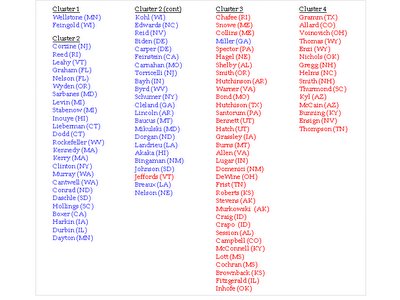
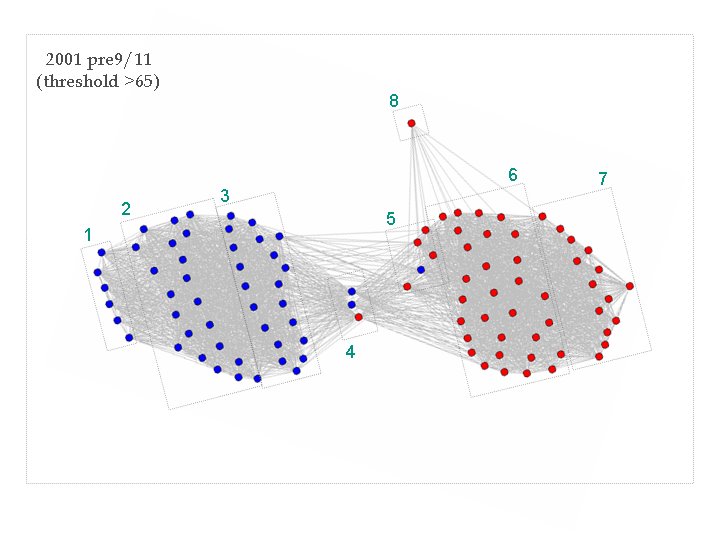
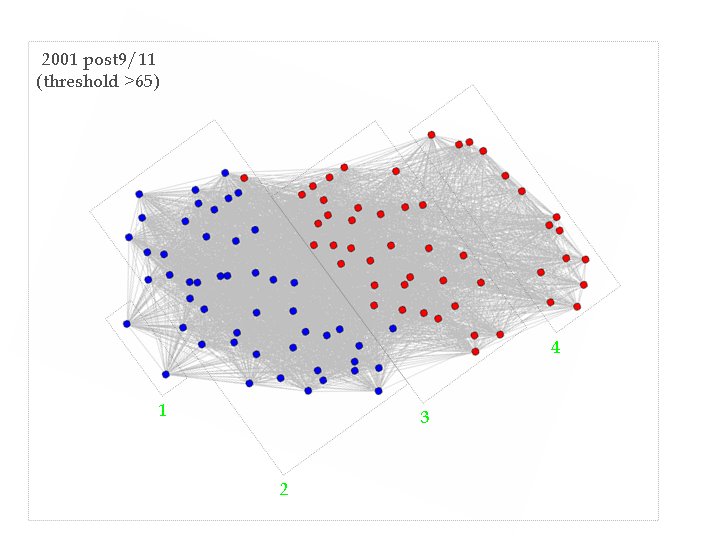
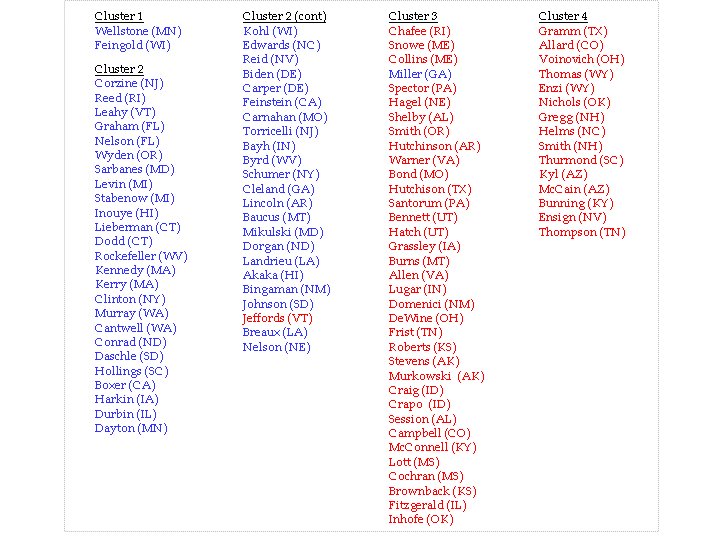
In the networks that follow I have split 2001 into pre- and post- 9/11. Also, I have split each network into clusters. The clusters are based on partitioning that I performed using Pajek. To show the clusters I have simply boxed and numbered them. Following each network visualization I include a table showing cluster membership. The biggest difference between the pre-and post- 9/11 voting patterns is that after 9/11 the senate was less polarized. This was not a surprising finding, it will happen when there are 100-0 votes. But not all of the votes were unanimous and the changes were not symmetrical. The far right did not change very much, while the far left suddenly started to vote like conservative Democrats.

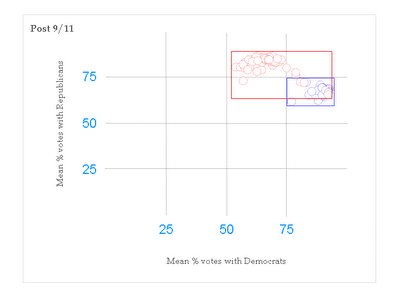
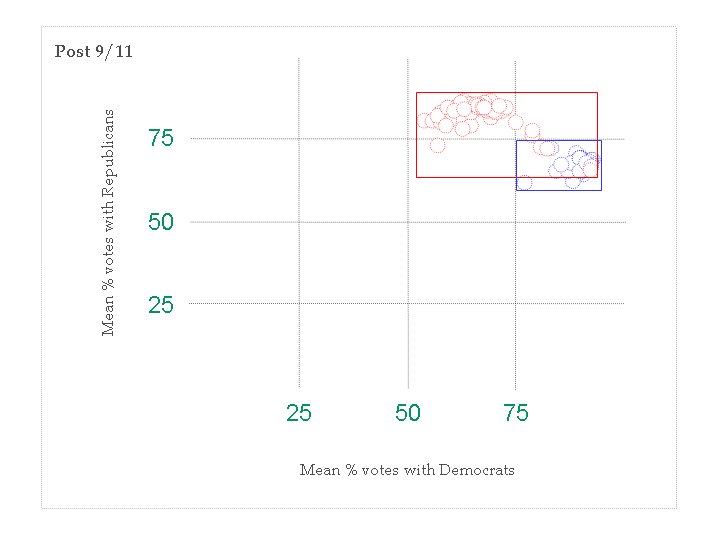
Another way to look at the voting changes after 9/11 is to plot how often senators voted within their party vs. outside their party. Again, the Democrats changed more than the Republicans. This can be seen best by comparing the boxes that I incuded that highlight the range or spread within each party. The Republicans retain a degree of heterogeneity, while the Democrats do not. You may remember that my previous post had a similar plot for 2005. From that it seems that the democrats have rebounded, by displaying a similar degree of voting heterogeneity that they had in the first eight months of 2001. Currently, I am analyzing data for the period between 2001 and 2005 to see when the rebound took place.

The first figure, I hope, explains what these networks represent. You can see in part (A) there is a small table that is part of a large table of vote data. For 2001 there were 380 votes, here you can see ten votes for just three senators. I take all of the votes and compute a matrix similar the one in part (B). The matrix summarizes the percent of votes that senators have in common. I use the percent numbers to make networks. The links in the networks have a weight to them that is the same as the percent from the matrix. In Pajek, the network analysis program, I set thresholds to reduce the weak links. Part (C) show a network before and after the threshold.
In the networks that follow I have split 2001 into pre- and post- 9/11. Also, I have split each network into clusters. The clusters are based on partitioning that I performed using Pajek. To show the clusters I have simply boxed and numbered them. Following each network visualization I include a table showing cluster membership. The biggest difference between the pre-and post- 9/11 voting patterns is that after 9/11 the senate was less polarized. This was not a surprising finding, it will happen when there are 100-0 votes. But not all of the votes were unanimous and the changes were not symmetrical. The far right did not change very much, while the far left suddenly started to vote like conservative Democrats.

Another way to look at the voting changes after 9/11 is to plot how often senators voted within their party vs. outside their party. Again, the Democrats changed more than the Republicans. This can be seen best by comparing the boxes that I incuded that highlight the range or spread within each party. The Republicans retain a degree of heterogeneity, while the Democrats do not. You may remember that my previous post had a similar plot for 2005. From that it seems that the democrats have rebounded, by displaying a similar degree of voting heterogeneity that they had in the first eight months of 2001. Currently, I am analyzing data for the period between 2001 and 2005 to see when the rebound took place.

posted by peoplewatcher at 9:26 PM
![]()
![]()

1 Comments:
Great Stuff!
Andrew, great stuff. Is this another reprise of the 100th Monkey trope?
Post a Comment
<< Home